Efficient road management – in the fast lane to a digital future
Planning, construction and maintenance of traffic routes and road infrastructure in general are among the most costly investments in the municipal sector. For this reason, it is particularly important to document and maintain the data of this infrastructure for sustainable use. The network information system BaSYS offers extensive functions for infrastructure planning and management with the BaSYS road tray and enables the use of the information of the above-ground road networks in direct context to the underground supply and disposal networks as a basis for interdisciplinary municipal infrastructure management.
Cadastre
With the BaSYS road cadastre, order and network data can be recorded and processed on the basis of a node-edge model. Traffic areas can be managed as line objects (with or without stationing) or as arbitrarily shaped polygons. The layer structure can be documented for each traffic area. It is also possible to record and manage road inventory such as traffic lights, lanterns or traffic signs.
This could be your solution? Send us a message and we will get back to you:
User interface
Data management is carried out with the help of clearly arranged detailed forms. A hierarchical navigation allows direct access to referenced data areas. The integrated network navigator enables a fast and comfortable visualization of the traffic infrastructure and bidirectional communication with the factual data of the road objects.
Interfaces
The flexibly adaptable import interface enables the import of files with the most varied characteristics and scopes in Shape and ASCII format. For example, the import interface can be used to completely transfer the results of a stereo image capture with precise geometric data, attribute data and traffic area conditions. A freely configurable Shape interface is also available for data delivery.
Condition and assessment
Condition data from visual condition surveys in accordance with EMI 2012 can be recorded, assigned and historically managed on an area-by-area basis. Results of road inspections within the scope of road safety obligations can be managed with reference to location.
The condition assessment based on working paper 9 of the FGSV for visual condition surveys is carried out with the help of a wizard that determines all the necessary data and thus ensures a correct condition assessment.
Visualization
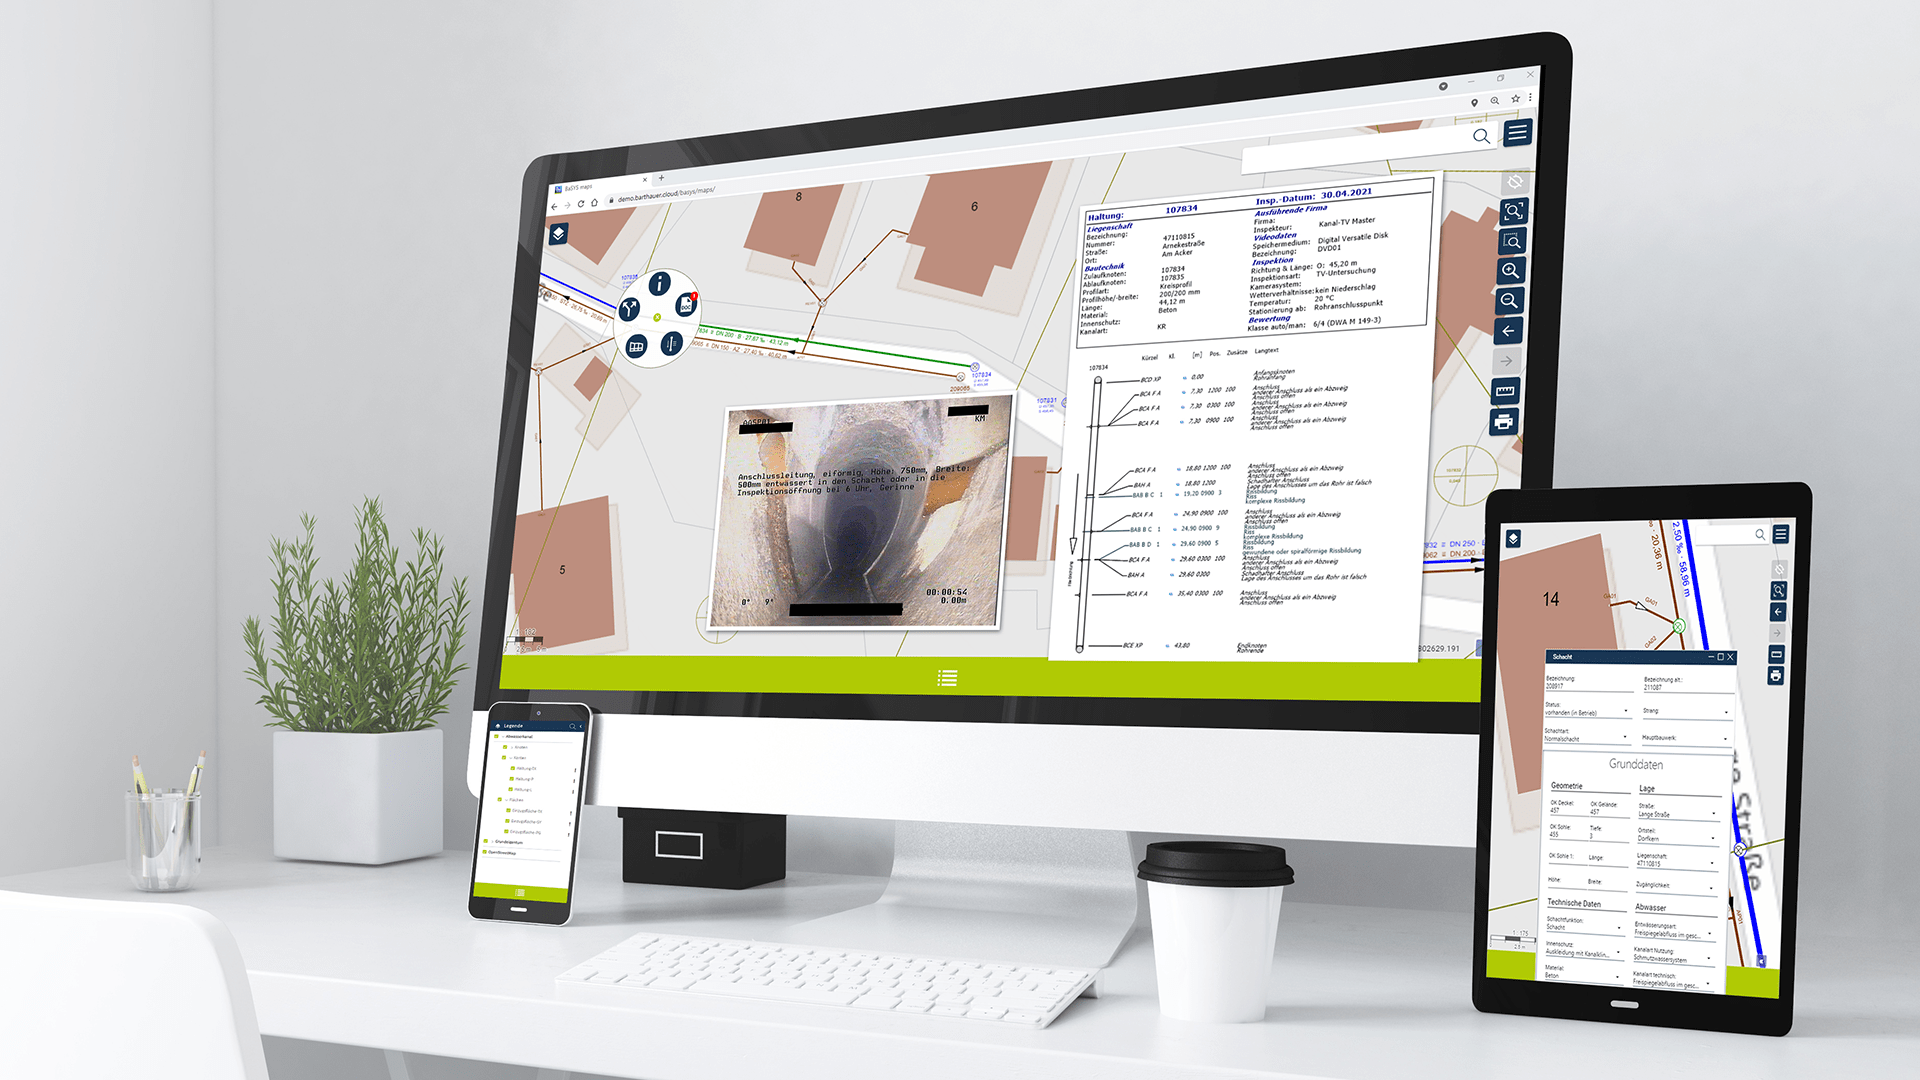
The visualization of the managed road infrastructure can be realized in all leading GIS and CAD systems. This currently includes CAD systems from Autodesk, Bentley, Bricsys and GIS from esri, Hexagon and QGIS. Furthermore, the visualization and editing of factual data is possible via web services.
The scope of the graphical presentation as well as the thematic design are realized by flexibly adaptable display models. By integrating the factual data forms into the GIS or CAD system, geometric and factual data are also provided in direct context here. Thanks to integrated data management, a joint visualization of road infrastructure data with underground infrastructure data, e.g. sewage networks, can also be realized.
The scope of the graphical presentation as well as the thematic design are realized by flexibly adaptable display models. By integrating the factual data forms into the GIS or CAD system, geometric and factual data are also provided in direct context here. Thanks to integrated data management, a joint visualization of road infrastructure data with underground infrastructure data, e.g. sewage networks, can also be realized.
Analysis
Dashboards, statistical evaluations, diagrams or freely definable reports are available for the analysis of road infrastructure data.
Efficient road management – in the fast lane to a digital future
Planning, construction and maintenance of traffic routes and road infrastructure in general are among the most costly investments in the municipal sector. For this reason, it is particularly important to document and maintain the data of this infrastructure for sustainable use. The network information system BaSYS offers extensive functions for infrastructure planning and management with the BaSYS road tray and enables the use of the information of the above-ground road networks in direct context to the underground supply and disposal networks as a basis for interdisciplinary municipal infrastructure management.
Cadastre
With the BaSYS road cadastre, order and network data can be recorded and processed on the basis of a node-edge model. Traffic areas can be managed as line objects (with or without stationing) or as arbitrarily shaped polygons. The layer structure can be documented for each traffic area. It is also possible to record and manage road inventory such as traffic lights, lanterns or traffic signs.
User interface
Data management is carried out with the help of clearly arranged detailed forms. A hierarchical navigation allows direct access to referenced data areas. The integrated network navigator enables a fast and comfortable visualization of the traffic infrastructure and bidirectional communication with the factual data of the road objects.
Interfaces
The flexibly adaptable import interface enables the import of files with the most varied characteristics and scopes in Shape and ASCII format. For example, the import interface can be used to completely transfer the results of a stereo image capture with precise geometric data, attribute data and traffic area conditions. A freely configurable Shape interface is also available for data delivery.
Condition and assessment
Condition data from visual condition surveys in accordance with EMI 2012 can be recorded, assigned and historically managed on an area-by-area basis. Results of road inspections within the scope of road safety obligations can be managed with reference to location.
The condition assessment based on working paper 9 of the FGSV for visual condition surveys is carried out with the help of a wizard that determines all the necessary data and thus ensures a correct condition assessment.
Visualization
The visualization of the managed road infrastructure can be realized in all leading GIS and CAD systems. This currently includes CAD systems from Autodesk, Bentley, Bricsys and GIS from esri, Hexagon and QGIS. Furthermore, the visualization and editing of factual data is possible via web services.
The scope of the graphical presentation as well as the thematic design are realized by flexibly adaptable display models. By integrating the factual data forms into the GIS or CAD system, geometric and factual data are also provided in direct context here. Thanks to integrated data management, a joint visualization of road infrastructure data with underground infrastructure data, e.g. sewage networks, can also be realized.
The scope of the graphical presentation as well as the thematic design are realized by flexibly adaptable display models. By integrating the factual data forms into the GIS or CAD system, geometric and factual data are also provided in direct context here. Thanks to integrated data management, a joint visualization of road infrastructure data with underground infrastructure data, e.g. sewage networks, can also be realized.
Analysis
Dashboards, statistical evaluations, diagrams or freely definable reports are available for the analysis of road infrastructure data.


BaSYS Street
Efficient road management – in the fast lane to a digital future
Planning, construction and maintenance of traffic routes and road infrastructure in general are among the most costly investments in the municipal sector. For this reason, it is particularly important to document and maintain the data of this infrastructure for sustainable use. The network information system BaSYS offers extensive functions for infrastructure planning and management with the BaSYS road tray and enables the use of the information of the above-ground road networks in direct context to the underground supply and disposal networks as a basis for interdisciplinary municipal infrastructure management.
Cadastre
With the BaSYS road cadastre, order and network data can be recorded and processed on the basis of a node-edge model. Traffic areas can be managed as line objects (with or without stationing) or as arbitrarily shaped polygons. The layer structure can be documented for each traffic area. It is also possible to record and manage road inventory such as traffic lights, lanterns or traffic signs.
This could be your solution? Send us a message and we will get back to you:
User interface
Data management is carried out with the help of clearly arranged detailed forms. A hierarchical navigation allows direct access to referenced data areas. The integrated network navigator enables a fast and comfortable visualization of the traffic infrastructure and bidirectional communication with the factual data of the road objects.
Interfaces
The flexibly adaptable import interface enables the import of files with the most varied characteristics and scopes in Shape and ASCII format. For example, the import interface can be used to completely transfer the results of a stereo image capture with precise geometric data, attribute data and traffic area conditions. A freely configurable Shape interface is also available for data delivery.
Condition and assessment
Condition data from visual condition surveys in accordance with EMI 2012 can be recorded, assigned and historically managed on an area-by-area basis. Results of road inspections within the scope of road safety obligations can be managed with reference to location.
The condition assessment based on working paper 9 of the FGSV for visual condition surveys is carried out with the help of a wizard that determines all the necessary data and thus ensures a correct condition assessment.
Visualization
The visualization of the managed road infrastructure can be realized in all leading GIS and CAD systems. This currently includes CAD systems from Autodesk, Bentley, Bricsys and GIS from esri, Hexagon and QGIS. Furthermore, the visualization and editing of factual data is possible via web services.
The scope of the graphical presentation as well as the thematic design are realized by flexibly adaptable display models. By integrating the factual data forms into the GIS or CAD system, geometric and factual data are also provided in direct context here. Thanks to integrated data management, a joint visualization of road infrastructure data with underground infrastructure data, e.g. sewage networks, can also be realized.
The scope of the graphical presentation as well as the thematic design are realized by flexibly adaptable display models. By integrating the factual data forms into the GIS or CAD system, geometric and factual data are also provided in direct context here. Thanks to integrated data management, a joint visualization of road infrastructure data with underground infrastructure data, e.g. sewage networks, can also be realized.
Analysis
Dashboards, statistical evaluations, diagrams or freely definable reports are available for the analysis of road infrastructure data.
Efficient road management – in the fast lane to a digital future
Planning, construction and maintenance of traffic routes and road infrastructure in general are among the most costly investments in the municipal sector. For this reason, it is particularly important to document and maintain the data of this infrastructure for sustainable use. The network information system BaSYS offers extensive functions for infrastructure planning and management with the BaSYS road tray and enables the use of the information of the above-ground road networks in direct context to the underground supply and disposal networks as a basis for interdisciplinary municipal infrastructure management.
Cadastre
With the BaSYS road cadastre, order and network data can be recorded and processed on the basis of a node-edge model. Traffic areas can be managed as line objects (with or without stationing) or as arbitrarily shaped polygons. The layer structure can be documented for each traffic area. It is also possible to record and manage road inventory such as traffic lights, lanterns or traffic signs.
User interface
Data management is carried out with the help of clearly arranged detailed forms. A hierarchical navigation allows direct access to referenced data areas. The integrated network navigator enables a fast and comfortable visualization of the traffic infrastructure and bidirectional communication with the factual data of the road objects.
Interfaces
The flexibly adaptable import interface enables the import of files with the most varied characteristics and scopes in Shape and ASCII format. For example, the import interface can be used to completely transfer the results of a stereo image capture with precise geometric data, attribute data and traffic area conditions. A freely configurable Shape interface is also available for data delivery.
Condition and assessment
Condition data from visual condition surveys in accordance with EMI 2012 can be recorded, assigned and historically managed on an area-by-area basis. Results of road inspections within the scope of road safety obligations can be managed with reference to location.
The condition assessment based on working paper 9 of the FGSV for visual condition surveys is carried out with the help of a wizard that determines all the necessary data and thus ensures a correct condition assessment.
Visualization
The visualization of the managed road infrastructure can be realized in all leading GIS and CAD systems. This currently includes CAD systems from Autodesk, Bentley, Bricsys and GIS from esri, Hexagon and QGIS. Furthermore, the visualization and editing of factual data is possible via web services.
The scope of the graphical presentation as well as the thematic design are realized by flexibly adaptable display models. By integrating the factual data forms into the GIS or CAD system, geometric and factual data are also provided in direct context here. Thanks to integrated data management, a joint visualization of road infrastructure data with underground infrastructure data, e.g. sewage networks, can also be realized.
The scope of the graphical presentation as well as the thematic design are realized by flexibly adaptable display models. By integrating the factual data forms into the GIS or CAD system, geometric and factual data are also provided in direct context here. Thanks to integrated data management, a joint visualization of road infrastructure data with underground infrastructure data, e.g. sewage networks, can also be realized.
Analysis
Dashboards, statistical evaluations, diagrams or freely definable reports are available for the analysis of road infrastructure data.
This could be your solution? Send us a message and we will get back to you: